In the short time since the Kentucky Derby has been run, I have been inundated with questions about the Preakness Stakes. I have been cornered at my kid’s soccer games, pulled aside at Cub Scouts and even held hostage in the men’s room at work by folks that have “Triple Crown Fever”. I have heard them give me a million reasons both for and against the prospect of having another Triple Crown winner this year.
In the course of these conversations, I have heard a few of these folks make some bold statements about how certain factors play out in the upcoming Preakness. Knowing that I have the data readily assessable, I figured I would do a little “mythbusting”.
Myth #1 – Watch out for those newcomers
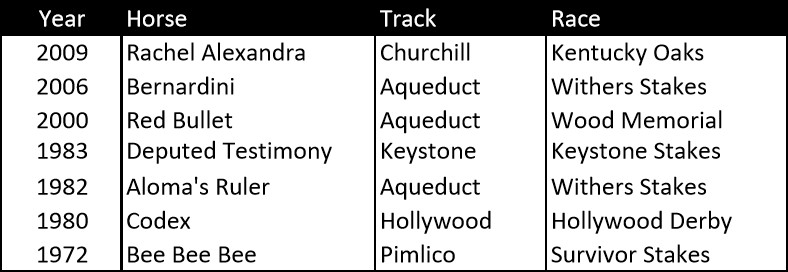
Every year the media warns us about those horses that skipped the Kentucky Derby and how we need to watch out for the newcomers or “new shooters.” I looked back over the last 50 years of the Preakness and found that there have only been seven horses in the last 50 years that have skipped the Kentucky Derby and won the Preakness Stakes.
PLAUSIBLE – While the odds are not in their favor, each newcomer must be considered before tossing.
Myth #2 – There are fewer horses that ran in the Derby in the Preakness field than there used to be
This is a number that varies from year to year. Whether the owners and trainers are scared of taking on the Kentucky Derby winner or have a better-fitting race in mind for their horse, there has been a slight downturn in the percentage of the field that ran previously in the Kentucky Derby showing up in the Preakness.
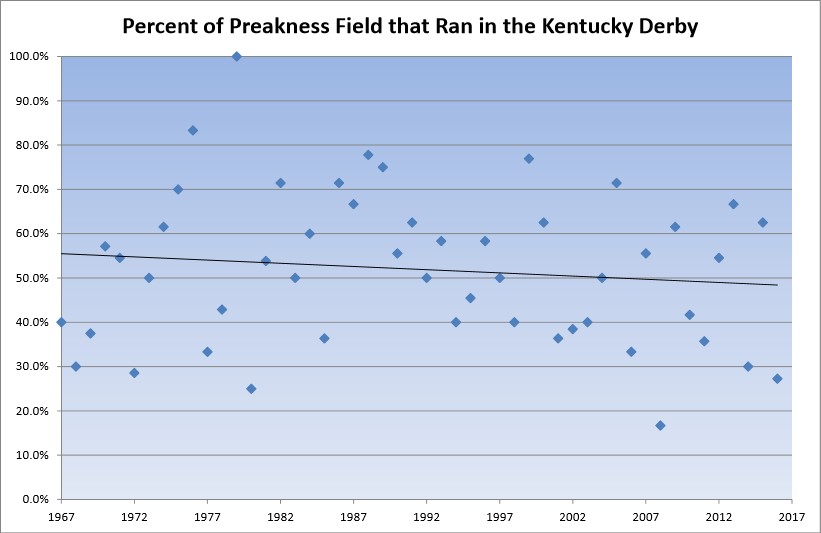
CONFIRMED – The chart above shows a moderate decline from the late 1960’s to today, from roughly 56% of the field having run in the derby to about 49%. The average and median number of entrants running in both races is about five. (At the time of this writing, there are five 2017 Kentucky Derby horses likely to run in the Preakness.)
Myth #3 – Favorites always do well in the Preakness
Over the last 50 years, the favorite has won the Preakness 22 times (44 percent). In my previous article, Not All Favorites Are Created Equal: Part 1, we showed that non-maiden favorites won at an overall rate of 33.9 percent.
PLAUSIBLE – So yes, while the last 50 years shows the favorite outperforming the norm, it is such a small sample that it can’t really be compared to the results that I showed over 16,065 races!
Myth #4 – The Favorite wins the Preakness more often than in the past
When we look at ten-year increments over the last 50 years, we see that the favorite’s winning percentage is fairly consistent. The favorite won in both 2014 and 2015 (California Chrome and American Pharoah), but, prior to that, the last winning favorite was Rachel Alexandra in 2009.
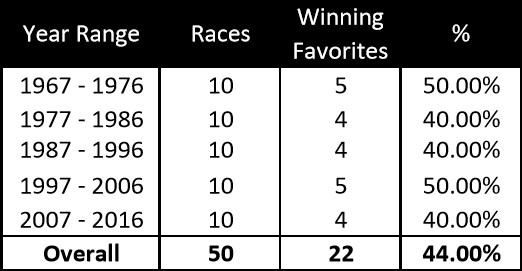
BUSTED – While the average odds of the Preakness winner have been just under 5-1 over the last 50 years, there has been no increase in the frequency of the favorite winning.
Myth #5 – The horse’s finish position in its last race is as important here as in the Kentucky Derby
The last seven Kentucky Derby winners won their final prep race, including Always Dreaming. Since 2000, 12 Derby champs also won their final prep (66.7 percent), with 16 (88.9 percent) finishing in the money.
The Preakness is a different story. Since 2000, just over half (52.9 percent) of the 17 horses won their last race and 13 of 17 (76.5 percent) finished in the money. Over the past 50 years, the numbers are similar: 52 percent of Preakness winners also won their last race, while 72 percent finished in the money last time.
BUSTED – Many of the horses that come out of the Kentucky Derby to run in the Preakness have been the victim of a troubled trip. In the 2017 Kentucky Derby, 12 of the 20 entrants experienced some kind of trouble, excluding Thunder Snow.
Myth #6 – Post Position matters
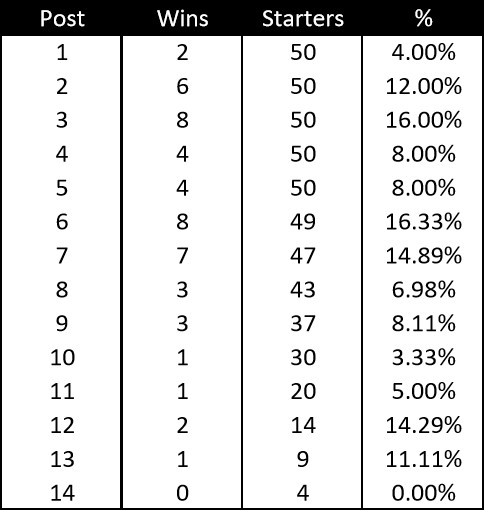
Over the last 50 years, the rail has only produced two winners. No horse has won from post 14 (granted, there have only been four horses to break from that post). Looking at the overall chart of all posts, both post 12 and 13 are outperforming what the average should be in both cases.

Grouping the posts as one through four, five through eight, and nine to fourteen, you can see that the inner eight posts win a majority of the races.
PLAUSIBLE – The inner eight posts win most of the time since the median and average field size here is about 10 horses. Not every post gets the strongest contenders and with the smaller sample sizes as you get further out, there is less of a likelihood that the fewer number of starters include as many strong horses as the inner posts that are filled every year. Yet, the fact remains that the rail has been a tough place to win from in the last 50 years. Only Tabasco Cat (1994) and American Pharoah (2015) have been able to score from the rail, albeit the average odds of those rail horses were 28-1 over the last 50 years!
Myth #7 – The pace in the Preakness is slower, which helps front runners
This is an interesting one. On average, Churchill Downs is about 2/5 seconds faster than Pimlico, so the times are actually much closer than you think. Since 2000, the fractional times in the Kentucky Derby have averaged about :46-1/5 and 1:10-4/5 for the half- and 3/4-mile calls, respectively. During the same period at Pimlico for the Preakness, the times have been :46-3/5 and 1:11-1/5. Subtracting 2/5 seconds makes the times even.
BUSTED – While the Preakness appears to feature a slower pace, the pace is roughly the same. While 14 of the last 18 Kentucky Derbies have been won by a horse with either an “E” or “E/P” running style (in the Brisnet past performances); since 2000, only six of the 17 Preakness Stakes have been won by those same running styles (four have been won by “P” types and seven have been by stalkers or closers).
What other Preakness myths or claims have you heard?
