One of the things I’ve learned during my long association with the Sport of Kings is that it’s difficult to turn a consistent profit playing the ponies, especially if one relies on simple methods and techniques, e.g. playing the horse with the best last-race speed figure, highest earnings per start, etc.
“Super systems” and “awesome angles” are invariably left gasping for air at the eighth pole when subjected to large database tests. And sticking a pin in the program is no better, producing a loss of approximately 25 percent per wager. In other words, if one started with $100 and bet $10 per race on a random choice, one would be broke after approximately 40 races (about 10 minutes of wagering action for me). Of course, one shouldn’t be betting in such a reckless fashion to begin with, but that’s a story for another day…
Given these sorry statistics, it’s easy to understand why it’s so tough to come up with a mechanical method that aids one in beating the parimutuel beast — or even wounding it slightly.
However, I believe I’ve done just that.
The method I came up with grades each entrant in four different categories — speed, class, jockey ability and trainer ability. The grades are then added together and divided by four, yielding a grade point average, which most of us are familiar with from our school days. The higher a horse’s GPA, the better its chances of winning — provided it also possesses reasonable “form” and “fitness” ratings (more on these later).
But before we discuss just how prescient the GPAs are, let’s take a look at some of the subcategories, starting with the speed grade. Before we start, I should mention that I came up with all of the category grades and ratings autonomously, rather than using any kind of regression technique. The reason for this stems from my belief that certain factors are interdependent. For example, a good finish last time out (form) is typically a good thing… but not if it came two years ago (fitness).
Hence, while some of the grades and ratings display beautiful progressions from grade to grade and rating to rating, others do not. Rest assured, though, there is a method to my madness.
Anyway, on to the speed grade:
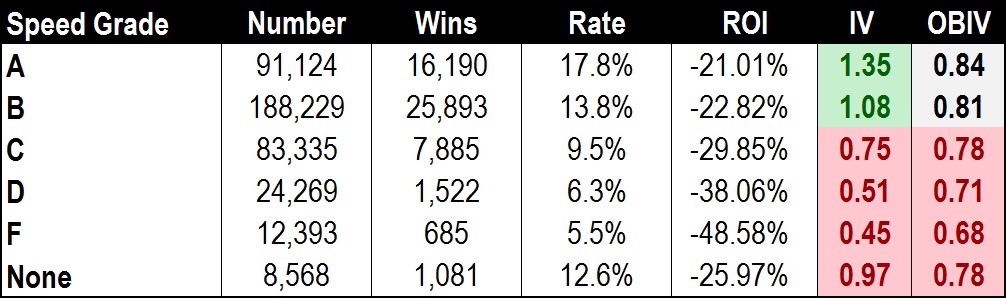
Note: All statistics are derived from approximately 55,000 random races run from 2012-2015
The biggest thing to note here is the negative nature of grades worse than a “B.” Part of the reason for this is that I didn’t use commercial speed figures — the popularity of such numbers greatly diminishes their effectiveness — and each grade encompassed a wide range of data.
The impact value, or IV, referenced above is a measurement of the number of times a winning horse shows a particular attribute compared to the number of times other entrants show that very same attribute.
If, for example, our study concentrated on horses between the age of 0 and 99 years old, we would expect the IV to be 1.00, as all race entrants — and race winners — would meet that stipulation. If, however, we were to focus on horses over the age of six, we would get an impact value of about 0.84 (I checked). Simply put, this means that horses six years of age or older win fewer — 16 percent fewer, to be exact — than their fair share of races.
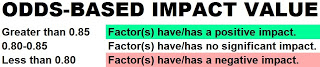 The odds-based impact value, or OBIV, follows a similar logic, except that the final odds, rather than the number of entrants, determine each horse’s probability of visiting the winner’s circle. Hence, if a horse favored at even odds wins, the OBIV would be 2.00 (1/0.5). Because takeout and breakage are part of the final odds, a neutral OBIV (comparable to an IV of 1.00) ranges from 0.80 to 0.85 (see chart above).
Let’s move on to class:
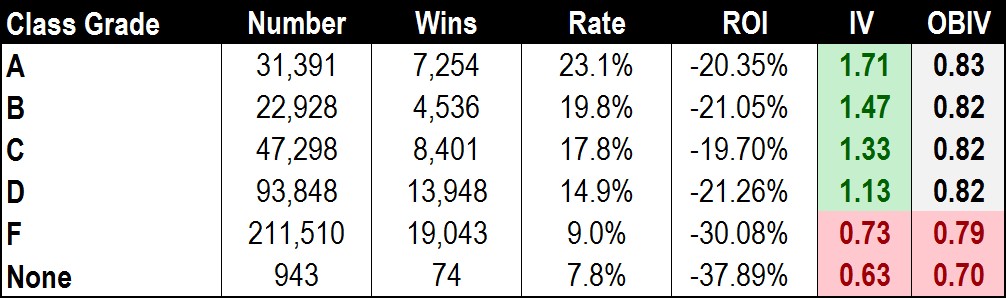
Here, again, is a category that is most meaningful in a negative context, as horses with an “F” rating — or no rating at all — greatly underperform.
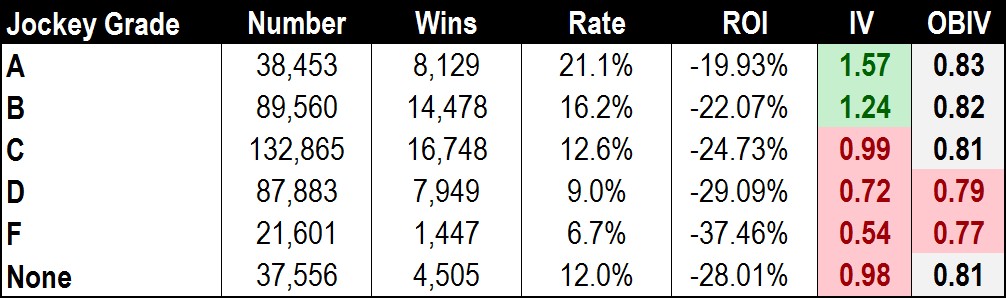
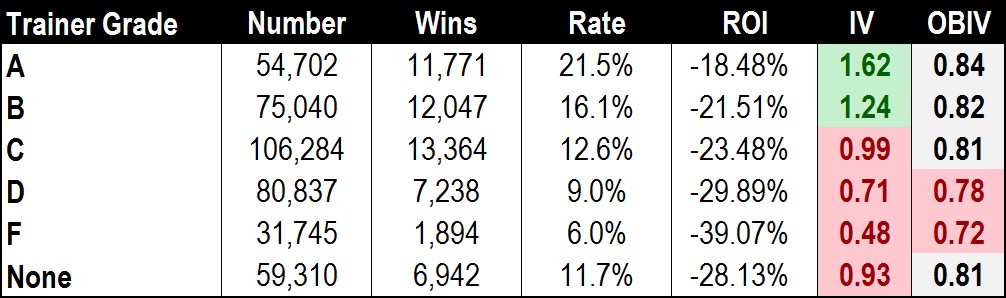
On to the jockey and trainer grades, where we see that beautiful progression I alluded to earlier:
Lastly, let’s take a look at the tests on form and fitness:
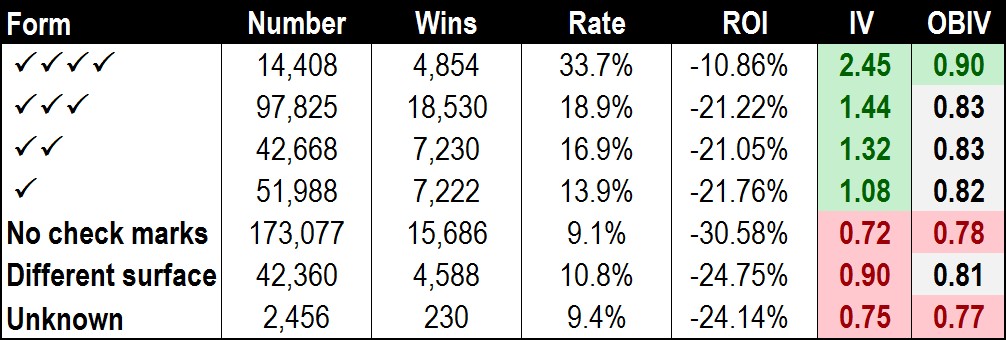
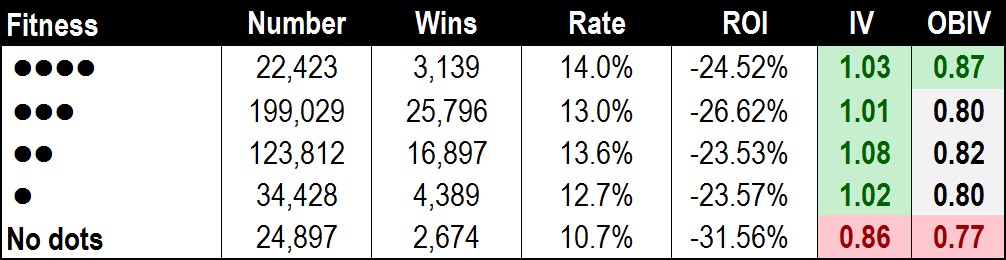
In what has become a common refrain, the biggest takeaway here is that horses with poor or unknown form (zero check marks) or those coming off layoff of 100 days or more (no dots) don’t win their fair share of races.
OK, while you’re still digesting those numbers — I apologize if they caused some of you gas pains — let’s take a look at the end product: GPA.
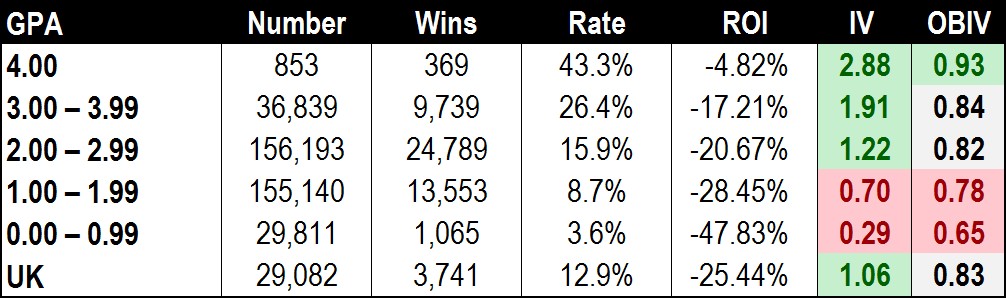
Frankly, I haven’t seen such a great progression since the guitar rift in Boston’s “More Than a Feeling.”
Horses with a 4.00 GPA win nearly half the time and are almost profitable with no other factors considered. This is an astounding result, greatly exceeding my expectations. What’s more, at each grade level, we see a pronounced difference in the stats.
And here’s the really good news: these Race Report Cards will be offered FREE at USRacing.com for selected programs. To get your free Race Report Card for all the great action at Belmont Park on Saturday, July 9, click HERE.


