Many moons ago, in his master work Betting Thoroughbreds, the late Steve Davidowitz coined the term “key race” to describe a race that featured an inordinate number of next-out winners. According to Davidowitz, these winners are generally not coincidental.
“Either [the key race] was superior to the designated class or else it contained an unusually fit group of horses. In either case, that’s important information,” the author wrote.
Apparently the Daily Racing Form agreed, as that esteemed publication soon began italicizing the names of next-out winners in its result charts and past performances.
Yet, by its very nature, the Key Race Method suffers from one very large and significant drawback: typically, by the time an event can confidently be deemed a key race it has lost its value as a predictive tool. After all, what good is it to discover a particularly strong race after half a dozen horses have already won their next start? Not only that, but given how infrequently horses compete today, it can take many weeks or even months to determine whether a past contest qualifies as a key race.
Hence, I decided to come up with a method of assessing key races that doesn’t require validation after the fact. Like Davidowitz’s initial technique, however, I wanted to keep it simple, so that even novice horseplayers could judge the merits of a particular race with just a modicum of time and effort.
Here’s how it works:
1) Using the result chart from a horse’s last race, find the median finishing position for all the entrants in their prior race. This information can be found in the leftmost column following the (abbreviated) track name. For example, by examining the chart below, one will discover that On Lockdown finished fifth in his last race, which was run at Oaklawn Park (OP) on March 15, 2012.
Note: For those who don’t have kids in school, the median is simply the middle value of an ordered array of numbers. If the array is even, it is the average of the two values closest to the middle.
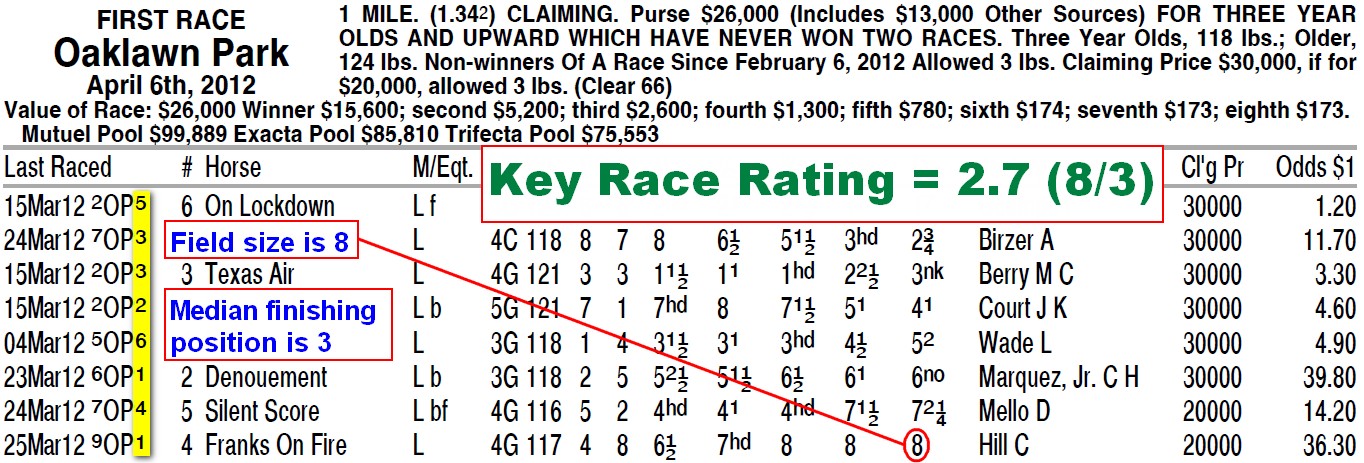
2) Divide the number of entrants, or the field size, by the figure obtained above to get the key race Rating.
That’s all there is to it; the higher the rating, the better the race was for the class. Notice I said “for the class.” Keep in mind that these key race ratings need to be viewed in light of the overall level of the race. A high rating in a $15,000 claiming event does not make a horse a contender against a rival that earned a much lower figure in a Grade I affair — it’s just common sense. However, in races featuring horses that last raced against similar competition, the ratings can be invaluable.
For the Kentucky Derby, I came up with a grading system (below) to address this problem:
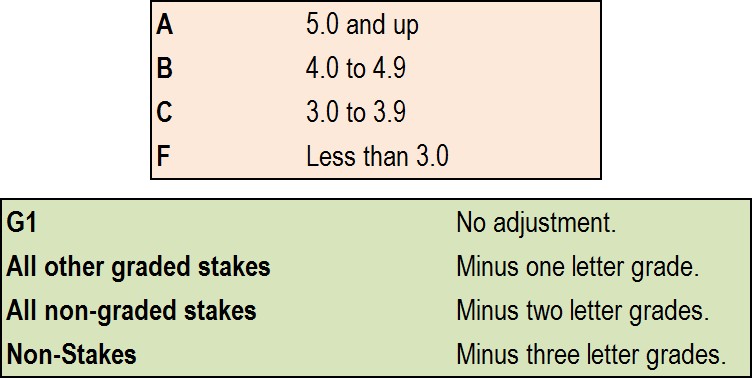
The last horse to win the Kentucky Derby after exiting a race with an “F” grade was Strike the Gold in 1991.
Here are the grades of the major preps in 2019:
| Race | Grade |
| Arkansas Derby | C |
| Blue Grass Stakes | C |
| Florida Derby | C |
| Lexington Stakes | F |
| Louisiana Derby | B |
| Lane’s End/Spiral Stakes | C |
| Santa Anita Derby | F |
| Sunland Derby | D |
| Tampa Bay Derby | B |
| Wood Memorial | B |


