There is a topic that many handicapping personalities talk about a lot. Some use it as an excuse for an unexpected performance, either good or bad. It is treated as through it is some sort of phenomenon, when in fact it is just simple math. If you haven’t guessed it by now, I am talking about what many folks call the “bounce”.
How many times do you listen to some of the big names or on-air handicappers at your local track talk about how a certain horse ran a huge race last out and looks to “bounce” here today? Likewise, they will use the same talk if the horse threw in a sub-par performance last out when they feel a horse should improve today.
Let’s face facts: Two- and three-year-old horses tend to improve with each start, since they are maturing and still growing. We almost expect improvement since they haven’t hit the top of their development curve. Many of them are still trying new surfaces and distances for the first time, so we can expect successes and failures as these animals develop and find where they are best suited. This can hardly be called a bounce — it is finding what works best for that horse!
Yet, when you look at older horses that have found their niche, whether it be sprints, routes, dirt, or turf, you will see a pattern of what appears to be improving and declining form. Whereas this has been labeled a bounce, it should rightfully be called what it is — a regression to the mean.
Let’s consider three random older horses that have run their last ten races under similar conditions from a low-level allowance race from Penn National. We will use the mean, or average, of the last ten races since these are older, more consistent horses and this value shouldn’t vary much if you go further back in their past performances. Using my own raw speed figures for this horse, which would work with any proprietary speed figure that is published, we can see a pattern.
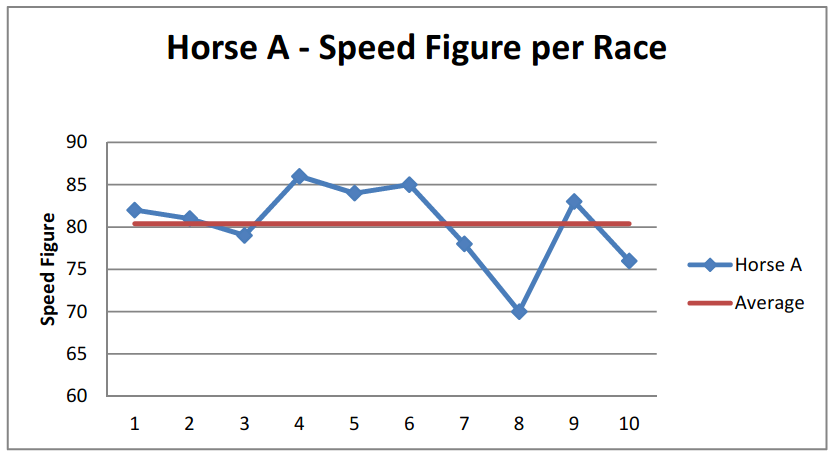


In this case, this you can see graphically that the horse has an average speed value, or mean, for this consistent set of races. There are peaks and valleys to the running line. These horses are not machines that run the exact same race every time. In fact, there is only a small chance that they run to the actual mean value!
Logic dictates that if the horse has run a worse figure than average that the next race it should do better. Likewise if the horse races above the average, you would expect the horse to run worse in its next start.
For those of us that were products of the 1970s and 1980s, trying to predict how the horse runs in its next start is a little like the old game show, Card Sharks. Card Sharks was a game show that appeared from 1978 through 1981 with Jim Perry as the host and later from 1986 – 1989 with Bob Eubanks.
Two contestants would answer questions to get control of the board where a card would be flipped over and they would need to predict whether the next card was higher or lower. Some choices were easier than others. If a two of diamonds appeared, the obvious choice was to say “higher”. Likewise, if the card was an ace, the obvious answer would be “lower”.
The choice became more difficult when the card was from the middle of the deck of cards, such as an eight. If you assume the average of the values of a deck of cards (using numerical values and adding one for each face card so a Jack is 11, Queen is 12, King is 13, and an Ace is 14), the average value of a card in a deck is eight.
Going back to our three horses, how does regression to the mean perform predicting whether a horse will run a better or worse speed figure than last out?
If every speed figure of the previous race is above the average value, we assume the next will be lower and likewise when a point is below the average value, we assume the next value will be higher. If the horse hits the average value, we will assume that the next race will be higher if the horse dropped to get to the average value or lower if the horse improved to get to the average value.
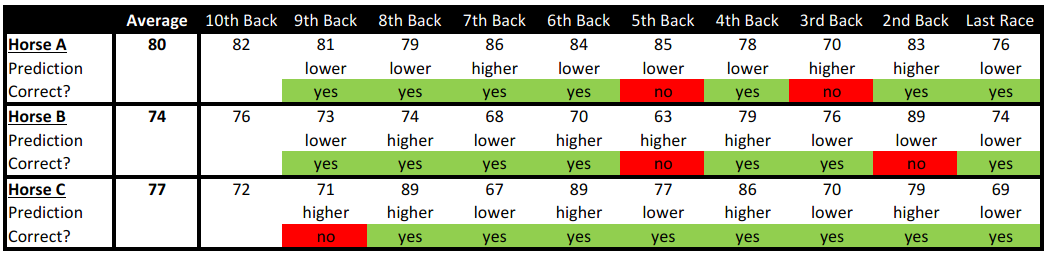
For example with Horse A, since the average is 80 and he ran an 82 in his 10th running line, we assume the next race would be lower. This prediction was correct since he ran an 81 in his ninth running line. Likewise since his ninth race back was still higher than his average of 80, we would assume that he would run lower in his next race.
We find that in the cases of Horses A and B, this analysis was true seven of nine times for each horse. For Horse C, the prediction was correct in eight of nine races. This equates to 81.5% without making any exceptions for troubled trips or discounting poor pace scenarios!
The bottom line is that older horses are creatures of habit. It is not that they are bouncing off of surprise performance — they are simply running back to what they are on average capable of. They may decline in form the older they get, but by monitoring their applicable running lines over their past performance running lines, you will be clued into whether the horse should perform better or worse than their last start.


